Spirion Spyglass Widgets
The Spyglass Widgets provide summary information, including counts and charts, for the currently selected Tags, Endpoints or Users restricted by any filters that are applied.
|
In this article |
Timeline Widget
The Timeline Widget Displays each individual search and the date on which the search was performed.
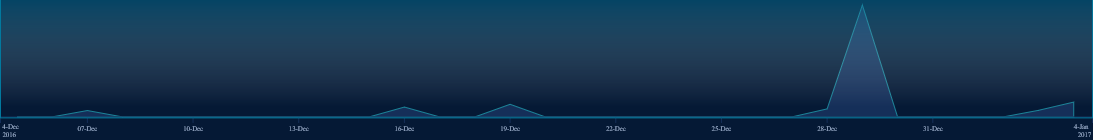
The Timeline Widget consists of two axes.
- The Y axis shows the quantity of records (i.e., matches) found for each individual search.
- The X axis shows the date that each search was performed.
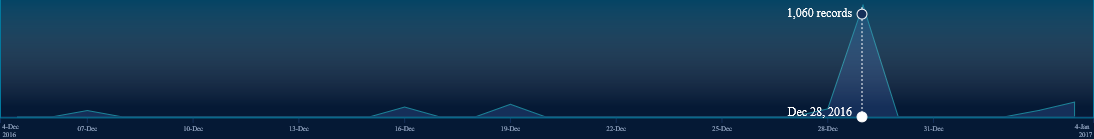
Moving your mouse along the Timeline a vertical dotted line displays showing the quantity of records that were that were found for a particular search and the date that the search was performed. In the screen shot below there was a search performed on December 28 which found 1,060 records (i.e., matches) containing sensitive data.
At the top left of the Timeline, in the Filter Bar, is a Timeline filter button. 
Clicking the button opens a filter which allows you to filter by date range.
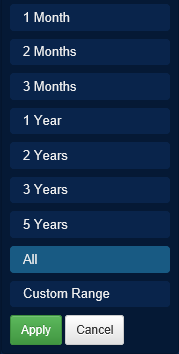
Highlight a date rage with the cursor and left click to select it. The following data ranges are available:
- 1 Month: Show only searches within the past one month.
- 2 Months: Show only searches within the past two months.
- 3 Months: Show only searches within the past three months.
- 1 Year: Show only searches within the past one year.
- 2 Years: Show only searches within the past two years.
- 3 years: Show only searches within the past three years.
- 5 Years: Show only searches within the past five years.
- All: Show all date ranges (this is equivalent to clearing the filter).
- Custom Range: This opens a double calendar that allows you to show only searches between two specified dates.
When a Timeline filter has been applied "Timeline" appears in the Filter Bar. Applying a Timeline filter updates the Timeline, Sensitive Data Footprint, Sensitive Data Heatmap, Searches, Protected Sensitive Data and Classified Data widgets to show only that information within the selected date range. To clear the Timeline filter to and show all available searches click the Timeline filter button and select All or select Clear All from the Filter Bar.
Sensitive Data Footprint Widget
The Sensitive Data Footprint Widget shows the total number of locations searched along with the amount of protected vs unprotected locations, regardless of the amount of sensitive data in that location. If there are 1,000 matches in a single document, it shows that as one location.
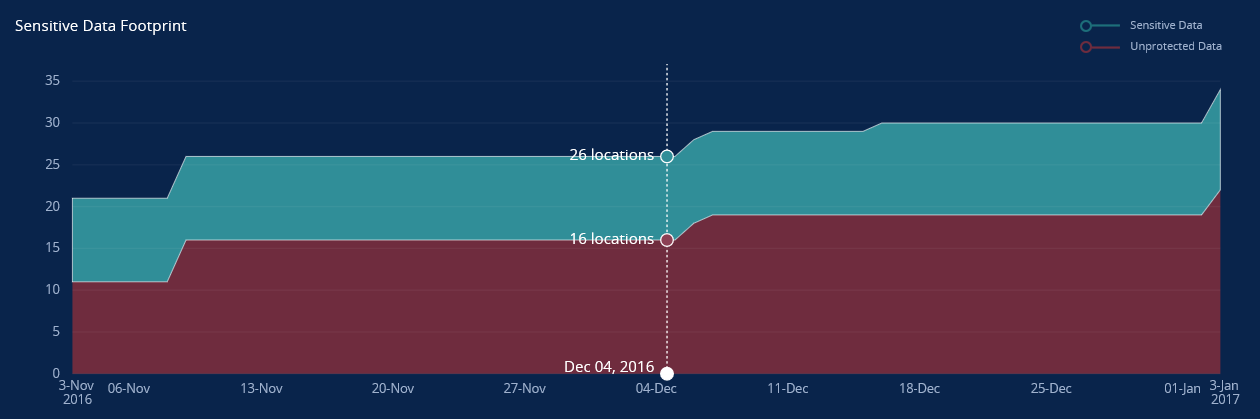
The Sensitive Data value represents the total number locations that contain matches. As you move the cursor left or right along the Sensitive Data Footprint widget, a vertical dotted line displays showing the date, the total number of locations searched on that date that contained matches, and the number of locations that contain unprotected data. In the screen shot above there was a search performed on December 04. In that search 26 locations were found to contain sensitive data and of those 26 locations 10 of them have since been protected leaving 16 locations unprotected.
The Sensitive Data Footprint Widget consists of two axes.
- The Y axis represents the quantity of locations containing matches aggregated over time across searches.
- The X axis represents the date.
There is a legend in the upper right of the widget showing what the two colors represent.
To show only the filtered information:
- Click the Sensitive Data or Unprotected Data text in the legend or the associated color in the Sensitive Data Footprint widget updates the Sensitive Data Footprint, Sensitive Data Heatmap, Searches, Protected Sensitive Data, and Classified Data widgets.
Protected Data vs Unprotected Data:
- Protected Data: Protected data is any result that has had an Action applied to it other than Ignore. For example, any result that has had the Shred, Redact, Encrypt, Quarantine or Recycle action applied to it from the endpoint or via the Console or that has a 'location does not exist' action state is considered Protected.
-
Unprotected Data: Unprotected data is any result that has not been protected with the Shred, Redact, Encrypt or Quarantine action. Unprotected data does not include matches that have an Ignored action.
Sensitive Data Heatmap Widget
The Sensitive Data Heatmap can show data by Tags, Endpoints or Users. To make your selection, left-click the down arrow left-click your desired choice.
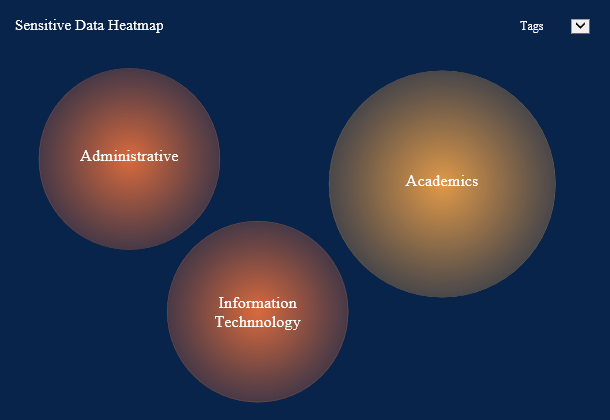
Left clicking a circle selects that circle and the Sensitive Data Footprint, Searches, Protected Sensitive Data, Classified Data, and Endpoint Status widgets update to include the data for the selected circle. When a circle has been selected it has a white border and appears on the Filter Bar. Clicking a selected circle again deselects that circle and removes that circle's data from the widgets. You may select as many circles as you wish by clicking on each. More than one circle may be selected at one time. When all circles have been deselected, that is the same as selecting all. You can also deselect the circles by clicking on the "X" next to the circle name in the Filter Bar.
If viewing by Tag, hovering your cursor over a circle shows the Tag name and the number of locations searched within the Tag.
If viewing by Endpoint, hovering your cursor over a circle shows the Endpoint name and the number of locations searched by the Endpoint.
If viewing by Users, hovering your cursor over a circle shows the User name and the number of locations searched by that User.
The relative size of each circle is based on the quantity of what is in the Tag, Endpoint or User. For example, the Tag with the most endpoints is larger in size than the Tag with 10% fewer Endpoints. The Tag with the least amount of Endpoints is the smallest circle.
The relative color of each circle represents how severe the problem is within that Tag, Endpoint or User compared to the others.
- Tags: It is based on the amount of unprotected locations in that Tag as compared to total locations containing matches in the Tag.
- Endpoints: It is based on the amount of unprotected records for that Endpoint as compared to the total locations on that Endpoint.
- Users: It is based on the amount of unprotected locations for that User as compared to total locations containing matches for that User.
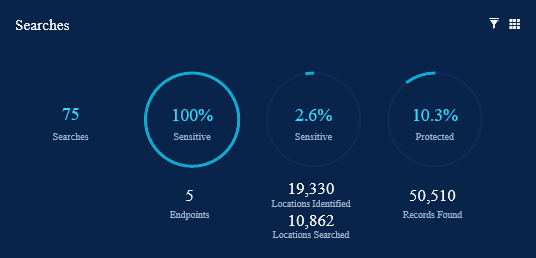
Searches Widget
The Searches Widget shows the number of searches that have been executed, number of managed endpoints searched, number of locations searched, number of records found and the percentage of data that is protected.
The Searches Widget is made up of five areas of information, from left to right.
| Field | Description |
|---|---|
| Searches | The total number of searches that have been performed. |
| Endpoints | The number of managed endpoints and the percentage of those endpoints that contain sensitive data. |
| Locations Identified |
The total number of locations seen during a search. This includes searchable and non-searchable locations. This is disabled by default and must be enabled in the UI Settings section of the Personal Settings page by enabling the Display locations identified in spyglass searches widget setting. In many cases, both Locations Identified and Locations Searched numbers are the same.
|
| Locations Searched | The total number of locations searched containing matches and the percentage of those locations that contain sensitive data. |
| Records Found |
The number of results found that have sensitive data and the percentage of those results that are protected.
|
There are two icons in the upper right of the Searches widget.
-
 : Clicking the Last Search icon displays the results for the most recent search for the selected Endpoint. When a tag is selected, clicking the Last Search button displays the results for the most recent search of each endpoint within the selected tag. For example, if there are 10 endpoints in the selected tag, clicking the Last Search button could display data for up to 10 searches. When the Last Search icon has been selected it appears filled and "Last Search" will appear in the Filter Bar. To clear the "Last Search" filter click the Last Search button again to remove it from the Filter Bar and the icon is no longer filled. You can also clear the filter by clicking the 'X' next to "Searches" in the Filter Bar.
 -
 : The widgets can be filtered to show only information from one or more specific searches. Clicking the Searches icon displays a grid of searches that contain the following information:
- Search Time: The date and time of the search.
- Endpoint Name: The name of the endpoint on which the search was run.
- Status: The current status of the endpoint on which the search was run. This is not the status at the time of the search itself, but rather the status of the endpoint at the time that the Filter by Search button was pressed.
- Task Name: An indication of how the search was executed. This displays User Initiated (The end user initiated the search through the Agent UI), Search Now (The Search button on the Console was used to initiate the search), the name of the task as specified in the Name field of the Add New Task dialog in the Scheduled Task section of a Policy or Task Deleted if the Task that ran the search has been deleted from the Scheduled Task section of a policy.
- Duration: The length of time the search took to complete.
- Total Matches: The total number of matches of all types discovered during the search.
- Showing n of n Searches: The number of times an endpoint was searched.
To select one or more searches, click the checkbox next to the desired search. To apply the filter, click the Submit button. When the filter is applied the icon appears filled and "N Searches" appears on the Filter Bar, where "N" is the number of searches you have selected. Applying a Searches filter updates the Timeline, Sensitive Data Footprint, Sensitive Data Heatmap, Searches, Protected Sensitive Data, Classified Data, and Endpoint Status widgets to show only that information within the selected date range. To clear the Searches filter click the 'X' next to "Searches" in the Filter Bar.
Protected Sensitive Data Widget
The Protected Sensitive Data Widget displays the Protected data by the Action that was applied to it.
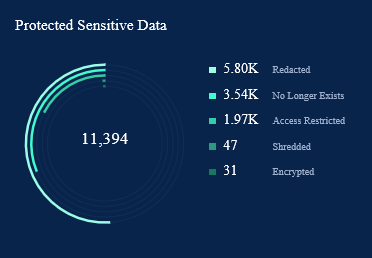
The Protected Sensitive Data widget consists of two areas. A graph on the left and Protection Action totals on the right.
The graph consists of five rings and a numerical value:
- Each ring represents one of the protection actions, with the relative size of each ring corresponding to the percentage of records protected with each Action out of the total quantity of records protected. The rings decrease in size from outer to inner with the outer ring representing the protection action with the greatest percentage of records with that protection action applied, and the inner ring representing the protection action with the fewest.
- The numerical value in the center of the rings is the total of the protection actions. In the screen shot above, 11,394 records have had a protection action applied to them.
The Protection Action totals show the number of records that have been protected with each action. Hovering your cursor over a number shows the exact count. The widget only lists those protection actions which have been applied to a record.
Classified Data Widget
The Classified Data Widget displays the top five Classifications defined in the Console by number of locations that have been assigned that Classification.
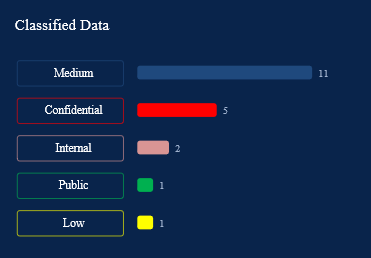
To filter by Classification click on the bar to the right of the Classification name and the Sensitive Data Footprint, Sensitive Data Heatmap, Searches, and Protected Sensitive Data widgets update to include the data for the selected Classification. When a Classification has been selected it has a white border and appears on the Filter Bar. Clicking a selected Classification again deselects that Classification and removes that Classifications data from the widgets. You may select as many Classifications as you wish by clicking on each. More than one Classification may be selected at one time. You can also deselect the Classifications by clicking on the "X" next to the Classifications in the Filter Bar.
Endpoint Status Widget
The Endpoint Status Widget provides you with the current state of the Endpoints.

The Endpoint Status widget consists of two areas. A graph on the left and a numerical percentage on the right.
The graph consists of an outer ring, an inner ring and a numerical value:
- The outer ring is a graphical representation of the four Endpoint search states divided into the four colors corresponding to each state with the relative size of each based on the number of Endpoints in each state. For example, if you have an equal number of endpoints in each of the four states, then the outer ring displays four equally sized segments in their corresponding color.
- The inner ring represents the Polling Normally vs Not Polling status, divided into the two colors corresponding to each with the relative size of each based on the percentage of Endpoints in each state.
- The numerical value withing the rings is the number of endpoints in the selected Tags, Endpoints, or Users in the Sensitive Data Heatmap widget.
The numerical percentages show the current state of each Endpoint and displays the following information:
- Search in Progress: A search has been initiated on the endpoint.
- Search Paused: The search is currently paused.
- Search Stalled: The endpoint has not reported any search progress to the Console after 6x the value in the Endpoints search progress update interval setting.
- Search Idle: The endpoint is not running a search at the present time.
- Polling Normally: The endpoint is polling the Console.
- Not Polling: The endpoint has not polled the Console in 24 hours.
Note: In order for an endpoint to report its status to the Console, the following policy setting needs to be enabled in a policy applied to the endpoint:
- Console\AgentActivityStateDataConfiguration - The Search Paused, Search Started and Search Canceled states must be enabled.
Filter Bar
The Filter Bar shows any filters which you have applied to the widgets. Each time you add a filter it is added to the Filter Bar.
When the Filter Bar is cleared of all filters it looks like this:
![]()
When there are filters applied the Filter Bar looks like this:

To clear an individual filter, click the "X" to the right of the filter.
To clear all filters, click the Clear All button.
To prevent the widgets from updating when the selection changes click the Stop button. This can be useful when you are organizing or managing tags and endpoints as it prevents the widgets from being reloaded and therefore eliminates any delay between clicking on an item and being able to select another filter. When the Stop button is enabled it has an underline.