Spirion Spyglass Overview
The Spyglass provides an overview of the search results across your entire environment. It displays counts, charts and data for the currently selected Tags, Endpoints or Users through seven widgets and shows any filters that are applied.
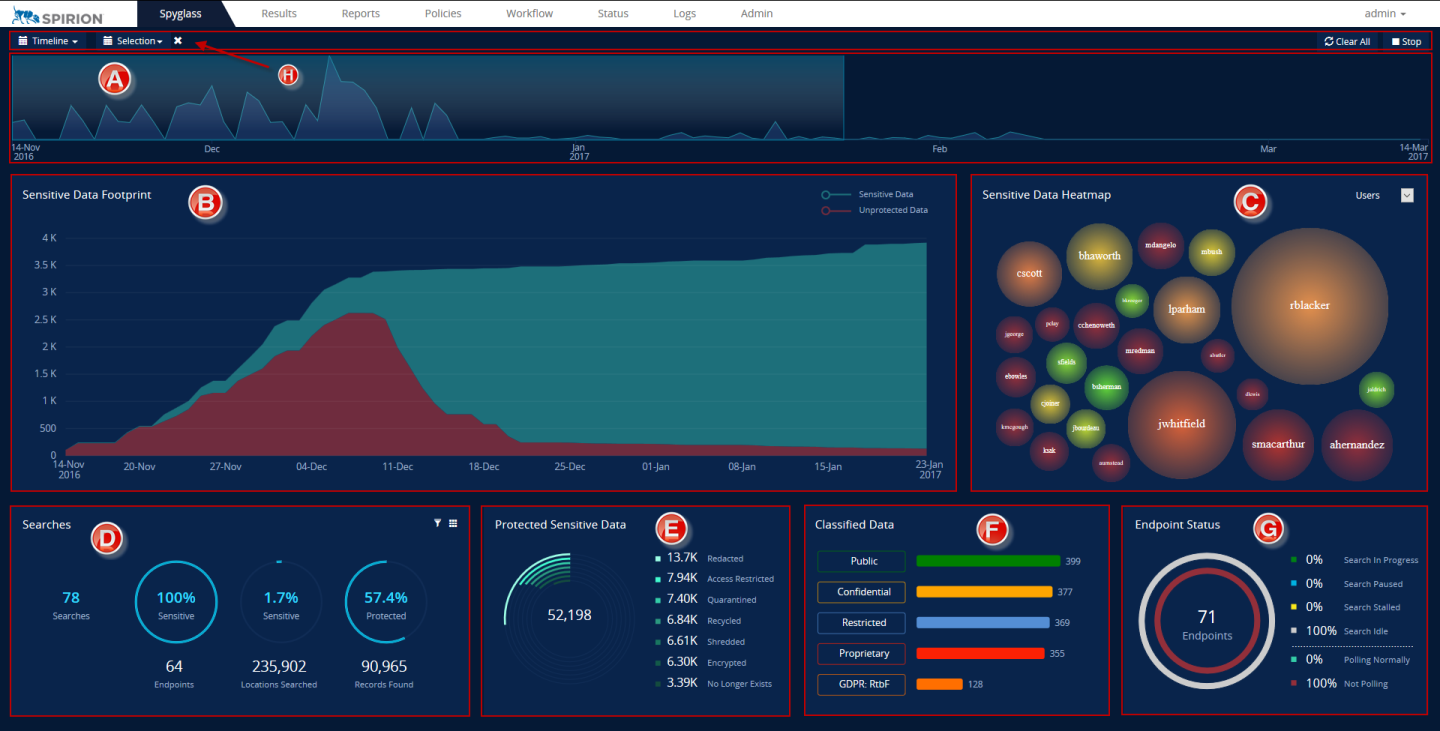
The Spyglass consists of seven widgets and a Filter Bar:
- Timeline Widget: Displays each individual search showing the quantity of matches and the date that each search was performed.
- Sensitive Data Footprint Widget: Shows the quantity of locations with matches aggregated over time across searches and the date that each search occurred.
- Sensitive Data Heatmap Widget: Displays sensitive data by Tags, Endpoints or Users so that you can see which areas have the biggest issue. The size and color of each circle indicates the degree of sensitive data relative to the other circles.
- Searches Widget: Shows the total number of searches that have been executed, number of managed endpoints searched, number of locations searched, number records found and the percentage of data that is protected.
- Protected Sensitive Data Widget: Displays the Protected data by the Action that was applied to it.
- Classified Data Widget: Displays the top five classifications by the number of locations that have been classified as each.
- Endpoint Status Widget: Displays the current status of the endpoints.
- Filter Bar: Shows the current filters for the Spyglass.
In This Chapter |