Logs Grid Overview
The Logs grid displays the log messages collected from the Spirion Enterprise Endpoints.
Log information can be sorted by clicking on specific column headers to toggle between ascending, descending and no sort. Any column to which sorting is applied displays an up arrow or a down arrow in the center of the column header indicating ascending or descending, respectively. No arrow indicates that column is not sorted. When a column header is clicked to set a sort, any previous sorting from all other columns is removed. The columns can be reordered by clicking on the column header and dragging and dropping them to the left or right.
The logs grid contains the following columns:
| Field | Description |
|---|---|
| Date/Time | This column displays the date and time that the log message was recorded on. |
| Endpoint | This column displays the name of the endpoint that the log message was recorded on |
| User | This column displays the name of the user who was running the Spirion Enterprise Endpoint session that performed the log message. |
| Type | This column displays the type of message (Error, Warning, Information). |
| Message | This column displays text of the log message. |
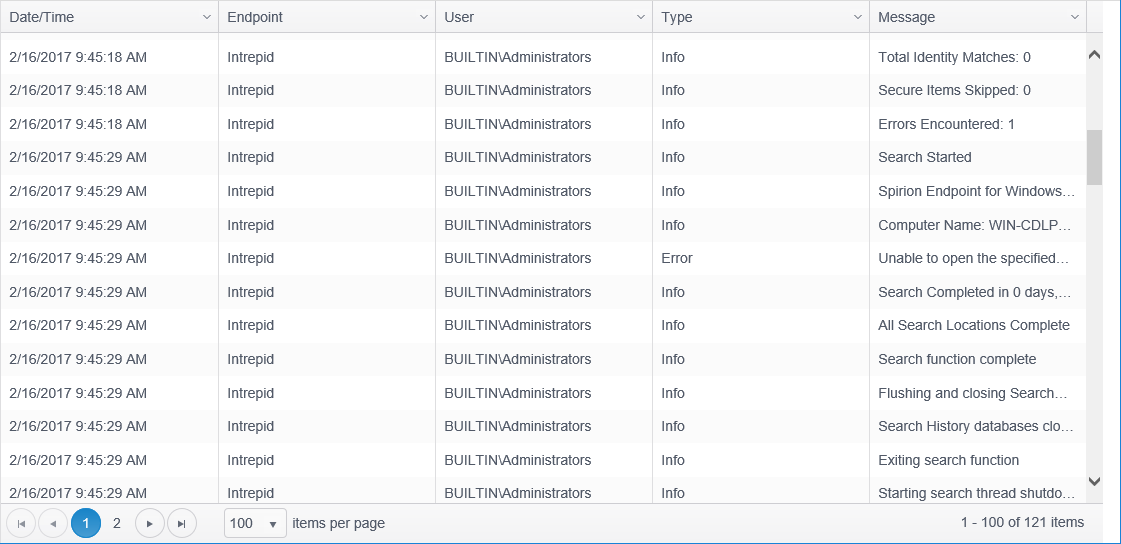
If necessary, the logs grid displays a Page Navigator at the bottom of the grid when there are more than 100 rows. Console has the ability to display large sets of data, however, it is not practical to display the entire data set in one view. The pager allows quick navigation between pages. Tabular data is displayed by splitting the data into pages, enabling the user to view large data sets by navigating forward and backward through the list of pages at the bottom of the grid.

The available elements of the pager are noted below:
-
 : Clicking the "First Page" button will return to the first page of results. This button will be disabled when viewing the first page.
 -
 : Clicking the "Previous Page" button will step backward through the pages, one at a time. This button will be disabled when viewing the first page.
 -
 : Clicking a specific page number will update the display to show the data on that page. The currently selected page number is highlighted in blue. A maximum of 9 page numbers will display at one time. If there are more than 9 pages of data, an ellipsis will be displayed. Clicking on the ellipsis to the right of the page numbers advances the results by 5 pages. Clicking on the ellipsis to the left will take you back 5 pages.
 -
 : Clicking the "Next Page" button will step forward through the pages, one at a time. This button will be disabled when viewing the last page.
 -
 : Clicking on the "Last Page" button will set the view to the last page of data. This button will be disabled when viewing the last page.
 -
 : The "items per page" drop down allows you to select the number of rows that will display per page. The default is 500.
When a column is being Filtered, the filter icon appears filled.