Endpoint Status View
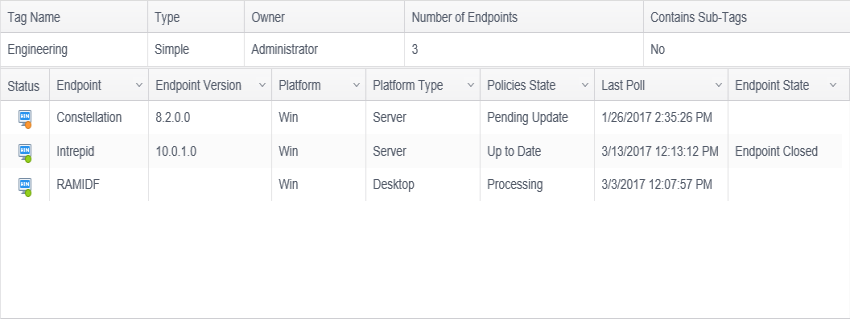
The Endpoint Status view displays detailed information about each endpoint selected in the Endpoint List (or all of the endpoints contained within the selected tag). The following columns are displayed:
| Field | Description |
|---|---|
| Tag Name | The name of the tag which you have selected. This column is only displayed when a Tag is selected. |
| Type | The tag type can be Simple, IP Range, Active Directory or LDAP and Filter. This column is only displayed when a Tag is selected. |
| Owner | The user that created the tag. This column is only displayed when a Tag is selected. |
| Number of Endpoints | The number of endpoints contained within the tag. This column is only displayed when a Tag is selected. |
| Contains Sub-Tags | If the endpoint belongs to a nested tag, this displays Yes. This column is only displayed when a Tag is selected. |
| Status | An icon that indicates the endpoint's platform (operating system) and a colored dot that indicates the current status of policies on that endpoint (policies state) or that the endpoint has been scheduled for removal. See the Endpoint Status page for a description of each icon. |
| Endpoint | The Display Name of the endpoint. |
| Endpoint Version | The version of the endpoint as reported by the endpoint. This data is reported when the endpoint service starts and when the endpoint sends search results to the Console. An empty value for this field indicates that the endpoint is unmanaged. |
| Platform | The platform of the endpoint as reported by the endpoint. This data is reported during GUID registration and when the endpoint sends search results to the Console. An empty value for this field indicates that the endpoint is unmanaged. |
| Platform Type |
The platform on which the selected endpoint is running. The possible values are:
|
| Policies State |
The state of policies for an endpoint. An endpoint can have multiple policies applied to it and any one of the policies could be modified which causes the Policies State for that endpoint to change. Additionally, if the endpoint is scheduled for removal, the word "Removed" is appended to the state. The valid values for the state are:
|
| Last Poll | The date and time (local to the Console server or GMT as defined on the Personal Settings page) that the endpoint last polled the Console to check for any new information (e.g., new policies, tasks, actions, application/license updates). An empty value for this field indicates that the endpoint is unmanaged. |
| Endpoint State |
Provides information about the state of the endpoint. By default, these states are not enabled and can be configured to be sent by endpoints with the following Policy setting in a System Policy applied to the endpoint: Console\AgentActivityStateDataConfiguration. You may select whether to display only the interactive states or both interactive and task related states through the configuration of the Display all Endpoint States in Endpoint Status tab setting on the Application Settings page.The valid values are:
|
-
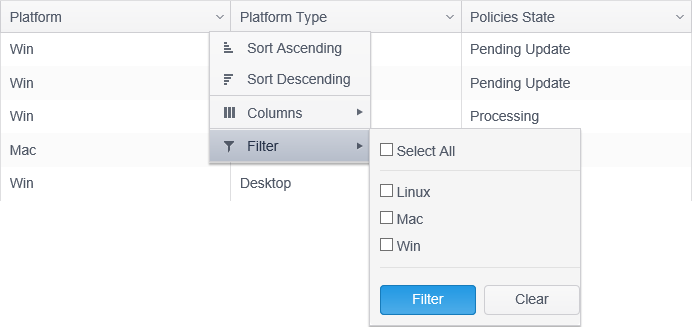
You may sort the endpoint status view by clicking on specific column headers to toggle between ascending, descending and no sort. Any column which has sorting on it displays an up arrow or a down arrow in the center of the column header indicating ascending or descending, respectively. No arrow indicates that column is not sorted. When you click on a column header to set a sort it removes any previous sorting from all other columns. You can sort multiple columns at the same time by holding down the shift key while selecting a sort. You can reorder the columns by clicking on the column header and dragging and dropping them to the left or right.
Filtering by column provides the ability to restrict the Status View to only display information that matches the specified, custom criteria. Multiple filters can be applied concurrently. To open the filter for any column, click on the filter icon on the column header. When a column is being filtered, the filter icon appears filled.

The Status View with a single endpoint selected:

The Status View with a tag selected, showing all of the endpoints contained within the tag:

You can view information from multiple endpoints by first selecting a tag from the Endpoint List. Then, from within the Status View, you can select multiple endpoints by holding the control key while left clicking with the mouse. As each additional endpoint is selected, the information in the Endpoint Status Detail is updated for all tabs except for the Details tab, which can only show information from one endpoint at a time. To deselect a single row hold down the control key while left clicking with the mouse.