View Group
|
In this article |
Filter Button
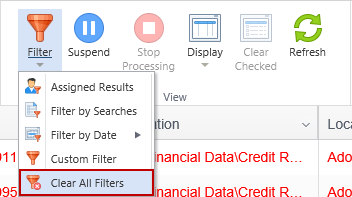
The Filter button provides the ability to restrict the Results View to only display information that has been assigned or from one or more specific searches or that matches the specified, custom criteria. Multiple filters can be applied at once and the filters are independent of any filters applied via the filter icon on each column header though in many cases the same filter can be applied by either method. The Filter button allows you to modify the Endpoint List to only display endpoints that contain the text provided in the filter.

Assigned Results
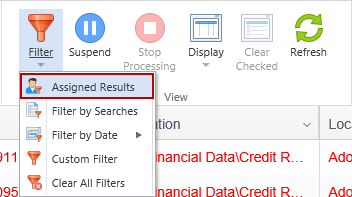
The Assigned Results button filters the Results Grid to show only those results that are assigned to the currently logged in Console user or to a role assigned to the user. Any additional filters that have been applied to the results are in effect. Therefore, if there is currently a column filter applied to the results, that column filter is still applied after clicking the Assigned Results filter button. Clicking the Assigned Results button again removes the Assigned Results filter.
Filter by Searches Button
The results grid can be filtered to show only information from one or more specific searches.
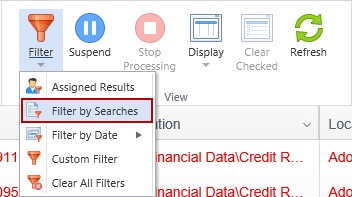
To use this filter:
- Click the bottom part (the down arrow) of the Filter by Searches button to display a list of relevant searches. If no searches are displayed, ensure that at least one tag or endpoint is selected in the Endpoint List and that at least one search has been performed by the selected endpoint(s).
- The grid of searches will be displayed and contain the following information about each search.
- Endpoint Name: The name of the endpoint on which the search was run.
- Search Time: The date and time that the search began.
- Status: The Status column may contain multiple icons:
- The first icon shows the current status of the endpoint on which the search was run. This is not the status at the time of the search itself, but rather the status of the endpoint at the time that the Filter by Search button was pressed.
- The second icon
 , if present, indicates any critical messages produced during the related search. Hovering over the icon with the mouse reveals a tooltip titled Endpoint Messages that displays the critical messages for that search. The messages can be any of the following:
- User stopped search: The user stopped the search prior to its completion.
- Outlook timed out: Outlook timed out while waiting for an Outlook operation to complete while the search was in progress.
- Outlook closed: Outlook was closed normally while the search was in progress.
- Outlook closed unexpectedly: Outlook was closed unexpectedly while the search was in progress.
- Task Name: An indication of how the search was executed. This displays User Initiated (The end user initiated the search through the client UI), Search Now (The Search button on the Console was used to initiate the search), the name of the task as specified in the Name field of the Add New Task dialog in the Scheduled Task section of a Policy or Task Deleted if the Task that ran the search has been deleted from the Scheduled Task section of a policy.
- Duration: The length of time the search took to complete.
- Total Matches: The total number of matches of all types discovered during the search.
- To select one or more searches, click the checkbox next to the desired search.
- To apply the filter, click the bottom part (the down arrow) of the Filter by Searches button.
- When the filter is applied, the top part of the button will be highlighted.
- To clear the filter, click the top half of the Filter by Searches button or the Clear All Filters button.
This filter will affect the Dashboard View as well as the Results View.
Filter by date Button
The results grid can be filtered to show information from a specific date or date range.
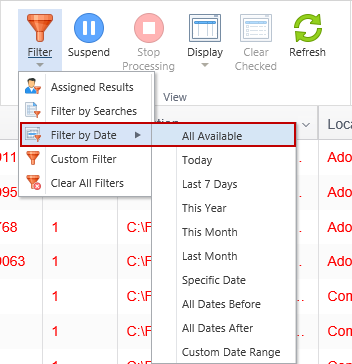
To use this filter:
- Click the bottom part (the down arrow) of the Filter by Date button to display a list of date options.
- The following menu items will be displayed:
- All Available: Show all date ranges (this is equivalent to clearing the date filter).
- Today: Show only searches that were started today.
- Last 7 Days: Show only searches that were started within the past 7 days.
- This Year: Show only searches that were started this calendar year.
- This Month: Show only searches that were started this calendar month.
- Last Month: Show only searches that were started last calendar month.
- Specific Date > Calendar: Show only searches that were started on a single, specified date.
- All Dates Before > Calendar: Show only searches that were started before a single, specified date.
- All Dates After > Calendar: Show only searches that were started after a single, specified date.
- Custom Date Range > Double Calendar: Show only searches that were started between two specified dates.
- To select any option that does not use a calendar, click the desired menu item. The menu will automatically close and apply the filter.
- To select an option that uses a calendar, click the option and a calendar will be displayed. Once the calendar is displayed, use the calendar navigation options to find the desired date and then click on that date. To apply the filter, click the bottom part (the down arrow) of the Filter by Date button to close and apply the filter.
- When the filter is applied, the top part of the button will be highlighted.
- To clear the filter, click the top half of the Filter by Date button, apply the All Available date filter or click the Clear All Filters button.
This filter will affect the Dashboard View as well as the Results View.
By default, the Console displays the first date and time an identity match was found as noted in the Date/Time column. To modify this behavior to always display the most recent time that the result was found, go to the Personal Settings page of the Admin tab and clear the check box from “Display the timestamp of the first time the identity match was found”. When results are filtered by a single date, only matches first found or last found on the selected date are displayed, depending on the value of this setting.
Custom Filter Button
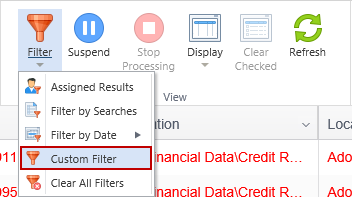
The Filter button provides the ability to restrict the Results View to only display information that matches the specified, custom criteria. Multiple filters can be applied at once and the filters are independent of any filters applied via the filter icon on each column header though in many cases the same filter can be applied by either method.

The Filter button provides the ability to filter on more information than just the available columns as well as additional filters for the columns not available in the column header filters.
The filterable items include:
- Action - A filter which restricts based upon a selected action that has been performed on one or more items in a results set.
- Assignee - A filter that allows selection based on specific existing assignees from the assignee list.
- Classification Name - A filter that allows selection based on text matching classification names.
- Classification Rules - A filter which allows selection of specific existing classification rules from the classification rules list.
- Classifications - A filter which allows selection of specific existing classifications from the classifications list.
- Data Types - A filter that allows selection based on specific existing data types from the data types list.
- Date/Time (First)- A filter which restricts based on the first time that a result was found using the selected date/time criteria. If the (All day) option is selected, the time portion of the filter does not display. If the (All day) option is not selected, the time portion of the filter displays and is applied.
- Date/Time (Most Recent) - A filter which restricts based on the most recent time that a result was found using the selected date/time criteria. If the (All day) option is not selected, the time portion of the filter displays and is applied.
- Endpoint Name - A filter that allows selection based on text matching endpoint names.
- Endpoints - A filter that allows selection of specific existing endpoints from the endpoints list.
- Last Action - A filter that allows selection based on specific existing actions from the actions list.
- Location - A filter which restricts by the location information available in a results set.
- Location Access Date/Time - A filter which restricts based on the date and time that the file was last accessed.
- Location Create Date/Time - A filter which restricts based on the date and time that the file was created.
- Location Modify Date/Time - A filter which restricts based on the date and time that the file was last modified.
- Location Pending Action - A filter which restricts based on an action that has been scheduled for a location but has not yet been executed by the endpoint. The possible values for this filter are: Ignore, Quarantine, Shred.
- Location Type - A filter which restricts by the type of location found as part of a results set.
- Location Type General - A filter which restricts based on a specific general location type stored in the database. For example, database table instead of the specific type of database.
- Match - A filter which restricts by match information available in a results set.
- Match Pending Action - A filter which restricts based on an action that has been scheduled for a match but has not yet been executed by the endpoint. The possible values for this filter are: Ignore.
- Match Quantity - A filter which restricts based on the match quantity information available in a results set.
- Owner - A filter based on object owner information, when this information is available.
- Search User Name - A filter which restricts based on an objects user name information, when available.
- Search Users - A filter which restricts by selecting specific user name information already collected for existing objects.
- Sensitive Data Type Name - A filter which restricts based on specific sensitive data type names. These are the names assigned to a Keyword, Regular Expression, Dictionary, Logic Statement and Search API in the Sensitive Data Types page of the Admin tab.
- Source Endpoint Name - A filter that allows selection of source endpoints based on text matching source endpoint names.
- Source Endpoints - A filter that allows selection of specific existing source endpoints from the source endpoints list.
- Tags - A filter that allows selection of specific tags to which the endpoint belongs.
- Workflow Status - A filter that allows selection of specific existing workflow statuses from the workflow status list.
Clear All Filters Button
The Clear All Filters button will be disabled when no filters are applied. When one or more filters are applied, the button will be enabled. Clicking the button will clear all filters and any filter buttons (such as Filter by Searches or Filter by Date) will lose their highlight. Clearing the filters will affect the Dashboard View, Results View, and Log View.
Suspend Button

The Suspend button prevents the view from updating when the selection in the Endpoint List changes. Suspending the view can be useful when you are organizing or managing tags and endpoints as it will prevent the Dashboard from being reloaded and will therefore eliminate any delay between clicking on an item in the Endpoint List and being able to use a ribbon button, a right click menu item, or a drag and drop operation.
Updates will be suspended for the Dashboard, Results View, Status View and Details, and Logs View.
Stop Processing Button

The Stop Processing button stops the view from updating when the selection in the Endpoint List changes. Unlike the Suspend button, which prevents the view from updating, the Stop Processing button only stops the current update. If you were to select another endpoint or tag the view would be updated.
Display Button
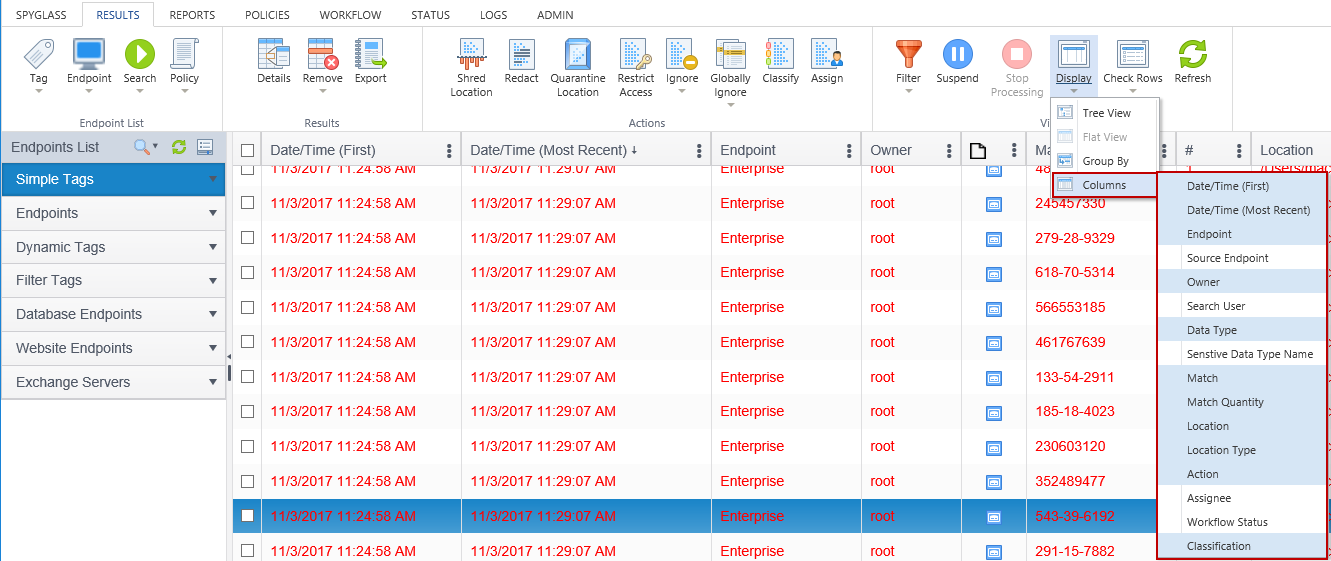
The Display button provides the ability to customize the results grid to display the results in a tree view, a flat view, by column grouping and to only display specific columns.
Flat View Button or Tree View Button

Click the Display button and then click Tree View to view the results grid as a tree, showing the parent/child relationship. To return to the flat view, click the Display button and click Flat View.
When viewing results in a flat view, there is no concept of parent/child when a location has multiple matches found. Every row in the search results has the location repeated.
When viewing results in a tree view, you see the parent/child relationship with the location, location type, endpoint, source endpoint, owner assignee and classification information being displayed only once, on the parent row. The child rows contain the information specific to that match.
Group By Button
The Group By button allows you to apply grouping to a column or columns. When grouping, all rows that have an identical value in the grouped column are rolled up into one row.

Clicking on the Group By button opens the Grouped by box in the upper left of the results pane. You can then click on a column header and drag it to the Grouped by box to group the results by that column. When you apply grouping to a column, all rows that have an identical value in the grouped column are rolled up into one row. (i.e., all endpoints with the same endpoint id or each specific location.) This way you can quickly see how many matches were found on a specific endpoint or in a specific location. Dragging and dropping a column header out of the Grouped by box ungroups that column. Alternatively, you can hover your mouse over one of the column headers in the 'Grouped by' box and click the 'x' in the corner to ungroup the rows in that column.
Columns Button
The Columns button allows you to select which columns display in the results grid. You can add or remove columns from the grid by clicking on the column name in the drop-down list to add or remove the check mark.
Check Rows Button
The Check Rows button provides the ability to select or deselect all rows across all pages of results.

Check All Rows
The Check All Rows button selects all rows across all pages of results by placing a check mark on each one. The Check All Rows button is enabled if the total number of rows is <= to 100,000. The total number of rows is visible in the bottom right of the Results grid.

Checking all of the rows refreshes the results data and may take up to 30 seconds to process depending on how many results there are for the selected Endpoint(s) or Tag(s). When you click the Check All Rows button the following dialog appears.
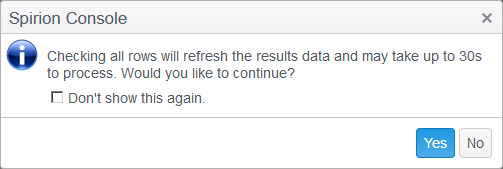
Click Yes to continue or No to cancel.
Clear Checked Rows
The Clear Checked Rows button removes the check mark from any checked row across all pages of results. For example, if you have checked rows spanning multiple pages, clicking Clear Checked removes the check mark from all rows across all pages. The Clear Checked button is only enabled when at least one row is checked on any page.

Refresh Button

If there are changes to results information that occur while viewing the results, it is necessary to manually refresh the Results View to reflect the changes in the database.
Click Refresh to update the Results View. When the Results View is refreshed it displays any new results that have been imported into the Console database. Any currently selected items within the results view are no longer selected. The Refresh button also refreshes the list of searches that displays when you select the bottom part of the Filter by Searches button.
