Using the Row Number column in a report
The Row Number column shows a sequential row number based on the sorting of the columns in your report and can be very useful for configuring a report to show instances of data without showing the duplicate data.
For example, let's say you want to create a report which will show each location on a specific endpoint which contains a match, but you only want to list each location once regardless of how many matches are found in that location.
If you created a report which just included the Location and the Match columns, it would list every location on that endpoint which contained a match, but if a particular location contained more than one match (e.g. 2 SSN's or an SSN and a CCN) then that location would be listed multiple times (once for each match found) and we don't want that.
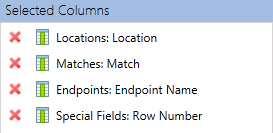
To create a report showing the data that what we want with each location listed only once, first you would add the following columns:
- Locations: Location
- Matches: Match
- Endpoints: Endpoint Name
- Special Fields: Row Number

A column which has no sorting on it is called a grouping column since the report will group based on that column. Once you apply sorting to a column it is no longer a grouping column. Sorting must be used (in conjunction with a grouping column) in order for Row Number to have meaning. If your sort is on a column where every value in that column is identical, then the row number will be the same for all rows (i.e. 1). If there is no sorting in your report, then the row number has no practical meaning and will show -1 for all rows. But when there is sorting, the Row Number value can be very useful for configuring a report to show instances of data without showing the duplicate data. So if you have two columns, the one with the sorting on it is the one to which the Row Number will apply. For this example we'll add sorting to the Matches: Match column so that every unique match within a group will have a different Row Number.

We do not want to see the endpoint name in the report since it would be repeated for every row in the report, but we still need to include the data from that column for use in constructing the report so we'll make the Endpoint Name column a hidden column.

And since we want to see only the locations for a specific endpoint we need to create a filter on the endpoint name (in this example the endpoint on which we want to filter is named "RAMIDF").

Let’s say we have this data as our results:
LOCATION 1, MATCH 1
LOCATION 1, MATCH 2
LOCATION 2, MATCH 1
LOCATION 2, MATCH 2
LOCATION 2, MATCH 3
As configured above using Location as a group column (no sorting) and sorting by Match our report would contain this data:
LOCATION 1, MATCH 1, Row Number 1
LOCATION 1, MATCH 2, Row Number 2
(// location change, hence restarting numbering)
LOCATION 2, MATCH 1, Row Number 1
LOCATION 2, MATCH 2, Row Number 2
LOCATION 2, MATCH 3, Row Number 3
And the report itself would look like this:

The report contains all of the information that we want, but not really in the usable format that we want it. We are not interested in seeing the specific Match nor do we want to see the Row Number so we make the Match column and the Row Number column hidden:


The report would now contain this data:
LOCATION 1
LOCATION 1
LOCATION 1
(// location change, hence restarting numbering)
LOCATION 2
LOCATION 2
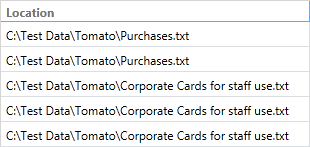
And the report itself would look like this:

But we are still showing each location multiple times so we will need to modify our filter to also filter on the following column: Special Fields: Row Number

Our report is now configured to group by Location, sort by Match within each Location and show only results from endpoints named "RAMIDF" with a Row Number = 1. The report now looks like this:
