Show Logs
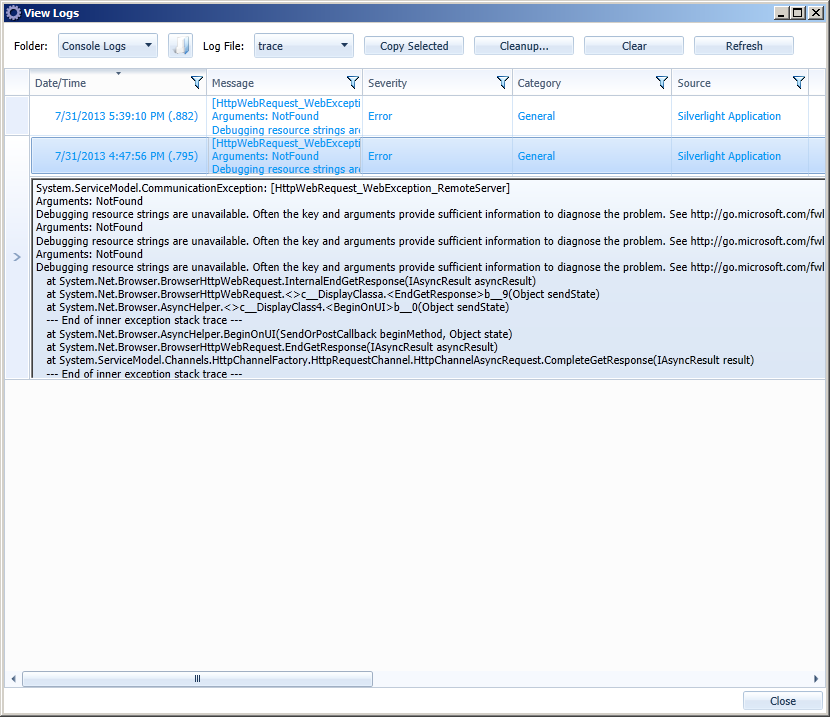
If the Console encounters an unexpected issue, a message is written to a log file. To view the logs and their options, launch the CAT and click the Show Logs... button in the lower-left corner. The information contained in the logs helps the support team determine the cause and resolution of the issue.

The View Logs screen has the following options:
| Field | Description |
|---|---|
| Folder |
Clicking on one of the selections in the Folder drop-down displays the log entries for the selected log. Once the entries are displayed, clicking on an entry expands that entry and shows the details of the selected entry. The available logs are listed below.
|
| Browse for Folder icon | Clicking on this icon opens the folder containing the log files for the log entries which are currently being viewed. |
| Log File | The Log File drop-down displays Trace if there is a trace file available, otherwise it is blank. |
| Copy Selected | Clicking on this copies the selected log entry to the clipboard. Click on one of the log entries to expand it and shows the details of that log entry. Next, click the Copy Selected button and the selected log entry is copied to the clipboard so that it can be pasted into a document or an email. |
| Cleanup... |
Deletes log entries based on a user specified time period. This deletes only the log entries for the log currently being viewed. For example, if you are viewing the Console log entries, then only the Console log entries are deleted. If you are viewing the services log entries, then only the service log entries are deleted. Clicking on the Cleanup... button opens a dialog box with the following options:
|
| Clear | Deletes all entries from the currently selected log file. You are prompted with the following confirmation dialog: "Do you want to remove all entries from the log?" |
| Refresh | If there have been additional entries to the log files while viewing the logs, it is necessary to manually refresh the logs view to reflect the changes. |

Columns and Filtering
You may sort the results by clicking on specific column headers to toggle between ascending, descending, and no sort. Any column which has sorting on it displays an up arrow or a down arrow in the center of the column header indicating ascending or descending, respectively. No arrow indicates that column is not sorted. When you click on a column header to set a sort it removes any previous sorting from all other columns. The available columns are noted below.
| Field | Description |
|---|---|
| Date/Time | The timestamp of when the log entry was written. |
| Message | The error message that was generated. |
| Severity | The severity of the error. |
| Category | The category into which the error falls. |
| Source | The application in which the error originated. |
Filtering by column provides the ability to restrict the Logs View to only display information that matches the specified, custom criteria. Multiple column filters can be applied at once. To open the filter for any column, click on the filter icon on the column header. To apply the filter, click the Filter button. To clear the filter, click the Clear Filter button. When a column is being filtered, the filter icon appears as filled. The available filters are noted below.
| Field | Description |
|---|---|
| Date/Time | A filter which restricts based on selected date/time criteria. |
| Message | A filter which restricts based on the error message. |
| Severity |
A filter which restricts based on the severity of the error. The valid values for this column are:
|
| Category |
A filter which restricts based on the category of the error. The valid values for this column are:
|
| Source |
A filter which restricts based on source of the error. The valid values for this column are:
|
 How do I launch the Console Administrator Tool (CAT)?